Automatic Failover - Dbvisit Observer
- Deepika Kumar (Deactivated)
- Jakub Sejba
- Vijayganesh Sivaprakasam
Purpose
The purpose of this page is to provide detailed information regarding the Dbvisit Observer, which is a new tool/component that is a part of Dbvisit Standby. It works together with and in addition to, the other major Dbvisit Standby components, which are dbvctl (Dbvisit Standby CLI), dbvnet (Networking communication), dbvagent (Inter-communication Agent) and dbvserver (Web-based Central Console).
The main functions of Dbvisit Observer are:
- Provide remote monitoring of existing DDCs, and inform the DBA of problems in close to real-time, and
- Automatically perform a Failover of the DDC if previously-specified conditions are met.
Introduction
Most will be familiar with the Dbvisit Standby architecture as shown in the diagram below. It can be summarized as follows:
- Dbvisit Standby has 4 key components:
- Dbvserver - also known as the Central Console or GUI.
- Dbvagent - the agent that runs on each host allowing secure connections from the Central Console.
- Standby Core - the heart of Dbvisit Standby from where core functions can be executed - this must be installed on the database server.
- Dbvnet - the network component that allows secure communication for the Dbvisit Standby components between primary and standby.
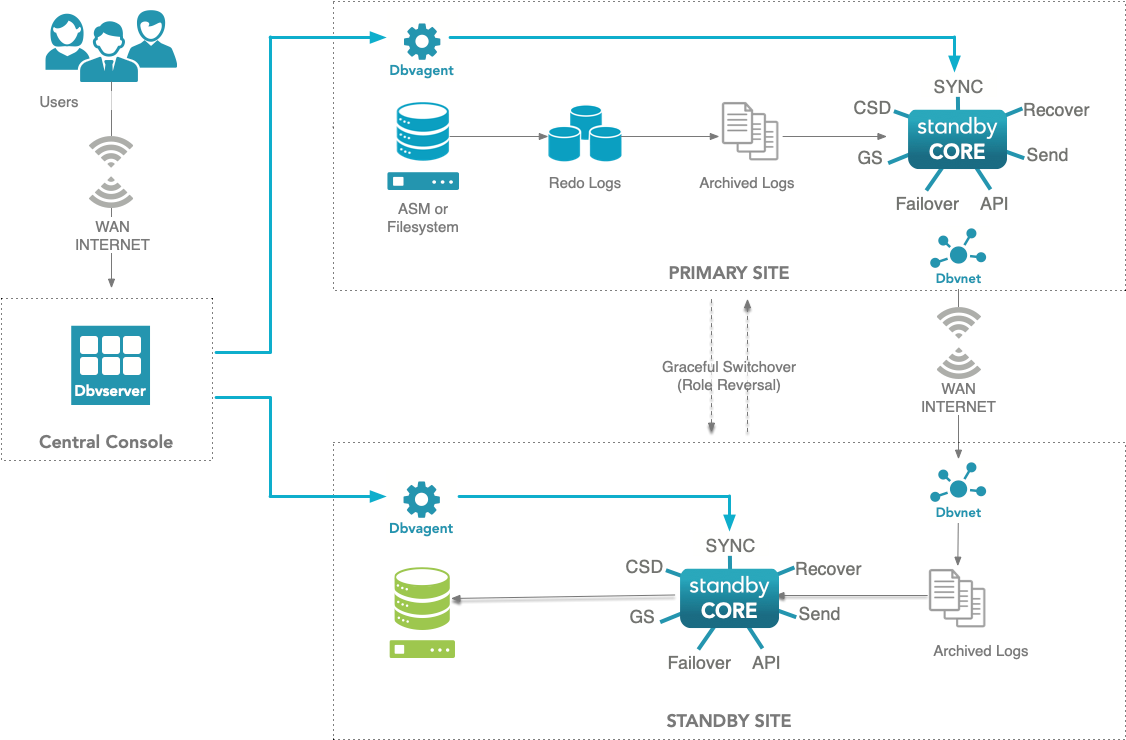
As you can see above, in most cases you will have a default configuration, where there is a Primary Site (at the top of the diagram) with a Standby Site (bottom of diagram), where the standby database will be created and kept up to date (by shipping archive logs from primary and applying them to the standby database) via the use of Dbvisit Standby. The primary and standby site can make use of ASM, OMF or even Oracle RAC configurations.
It is important to understand the above architecture before we discuss the new Dbvisit Observer feature that allows Automatic Failover capability.
Dbvisit Observer Architecture Diagram
First, lets visualize this new component from a high level:
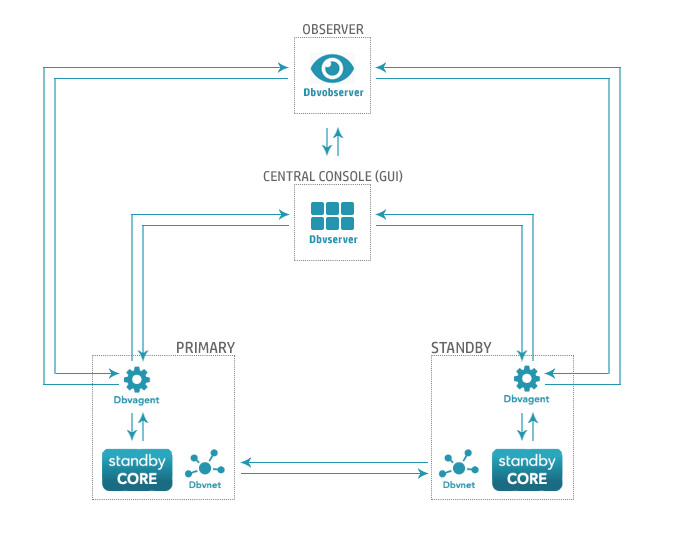
As you can see, the Observer is a completely stand-alone component that can be used to keep an eye on your configurations.
Some important points:
- The Observer can be installed both completely on its own as well as together with any other Dbvisit component, e.g. you could have the Observer and the Central Console running on the same host.
- Once installed, the Observer should be always running, even if there are no defined DDCs for it to monitor, or if all monitoring is switched off.
- Observer & Agent: The Observer initiates all communication with dbvagent, i.e. dbvagent does not push information to the Observer.
- Observer & Central Console: The Central Console initiates all communication with the Observer, i.e. the Observer does not push information to the Central Console.
Video Overview of Dbvisit Observer
This video covers all the basics of how the Observer works, how to install and use it. Please watch it before continuing to read this document:
System Requirements
The following Operating Systems are currently supported:
- Oracle Linux 6 and above
- Red Hat Linux 6 and above
- Windows Server 2008 and above (64bit)
Please note: This does not mean you cannot monitor a Dbvisit Standby configuration that is running on Solaris or AIX. Only the dbvobserver component must run on the supported OSs above, but the Database servers themselves can be on any OS supported by Dbvisit Standby.
We do not recommend installing the Observer on your Database servers, but rather on a separate system - we recommend installation on the same system where you install the Central Console (Dbvserver).
For example, you can install the dbvserver and dbvobserver components on a Oracle Linux or Red Hat Linux 7 system (Virtual Machine or even Docker - just make sure you have persistent storage for the configuration folders), and have this system monitor and manage any other Dbvisit Standby version 10 supported configuration.
Getting Started
In this section, we will take you through a basic setup on a new system to explain how this works.
Example - Installing the environment
The environment we will use in this configuration consists out of 2 systems:
- dbvel71 - Primary Database Server running an 18c database called orcl
- dbvel72 - Standby Database Server that will be used as the Standby Database - Oracle 18c database software is installed and matches the Primary exactly.
- dbvel72 - Central Console and Observer system. This is where the Dbvserver (GUI) will be installed as well as the new Dbvisit Observer component.
Step 1: Installing the Dbvisit Standby Software on Primary and Standby.
This step should be familiar to most, if not please refer to the Install Dbvisit Standby section in the User guide
Step 2: Installing Dbvisit Observer
The next step is to install the Dbvisit Observer onto the 2nd Node dbvel72. This system will also run the Central Console (GUI) and the Dbvisit Observer component.
[oracle@dbvel72 ~]$ pwd
/home/oracle
[oracle@dbvel72 ~]$ cd 10.0/
[oracle@dbvel72 10.0]$ ls
dbvisit  dbvisit-standby-10.0.0RC_24_g94ba1d85-el6.tar  dbvisit-standby-10.0.0RC_24_g94ba1d85-el6.zip  INSTALL.txt  README.txt
[oracle@dbvel72 10.0]$ cd dbvisit
[oracle@dbvel72 dbvisit]$ cd installer/
[oracle@dbvel72 installer]$ ls
doc  install-dbvisit
[oracle@dbvel72 installer]$ pwd
/home/oracle/10.0/dbvisit/installer
[oracle@dbvel72 installer]$ ./install-dbvisit

-----------------------------------------------------------
    Welcome to the Dbvisit software installer.
-----------------------------------------------------------

    It is recommended to make a backup of our current Dbvisit software
    location (Dbvisit Base location) for rollback purposes.

    Installer Directory /home/oracle/10.0/dbvisit

>>> Please specify the Dbvisit installation directory (Dbvisit Base).

    The various Dbvisit products and components - such as Dbvisit Standby,
    Dbvisit Dbvnet will be installed in the appropriate subdirectories of
    this path.

    Enter a custom value or press ENTER to accept default [/usr/dbvisit]:
     >
    DBVISIT_BASE = /usr/dbvisit

    -----------------------------------------------------------
    Component      Installer Version   Installed Version
    -----------------------------------------------------------
    standby        10.0.0RC_24_g94ba1d85                             10.0.0RC_24_g94ba1d85
    dbvnet         10.0.0RC_24_g94ba1d85 (dbvnet v1.5.0-301-g3896e54)10.0.0RC_24_g94ba1d85 (dbvnet v1.5.0-301-g3896e54)
    dbvagent       10.0.0RC_24_g94ba1d85                             10.0.0RC_24_g94ba1d85
    dbvserver      10.0.0RC_24_g94ba1d85                             10.0.0RC_24_g94ba1d85
    observer       10.0.0RC_24_g94ba1d85                             not installed

    -----------------------------------------------------------

    What action would you like to perform?
       1 - Install component(s)
       2 - Uninstall component(s)
       3 - Exit

    Your choice: 1

    Choose component(s):
       1 - Core Components (Dbvisit Standby Cli, Dbvnet, Dbvagent)
       2 - Dbvisit Standby Core (Command Line Interface)
       3 - Dbvnet (Dbvisit Network Communication)
       4 - Dbvagent (Dbvisit Agent)
       5 - Dbvserver (Dbvisit Central Console) - Not available on Solaris/AIX
       6 - Dbvisit Observer (Automatic Failover Option) - Not available on Solaris/AIX
    Press ENTER to exit Installer

    Your choice: 6

-----------------------------------------------------------
    Summary of the Dbvisit OBSERVER configuration
-----------------------------------------------------------
    DBVISIT_BASE /usr/dbvisit

    Press ENTER to continue

-----------------------------------------------------------
    About to install Dbvisit OBSERVER
-----------------------------------------------------------
    Component observer installed.

    -----------------------------------------------------------
    Component      Installer Version   Installed Version
    -----------------------------------------------------------
    standby        10.0.0RC_24_g94ba1d85                             10.0.0RC_24_g94ba1d85
    dbvnet         10.0.0RC_24_g94ba1d85 (dbvnet v1.5.0-301-g3896e54)10.0.0RC_24_g94ba1d85 (dbvnet v1.5.0-301-g3896e54)
    dbvagent       10.0.0RC_24_g94ba1d85                             10.0.0RC_24_g94ba1d85
    dbvserver      10.0.0RC_24_g94ba1d85                             10.0.0RC_24_g94ba1d85
    observer       10.0.0RC_24_g94ba1d85                             10.0.0RC_24_g94ba1d85

    -----------------------------------------------------------

    What action would you like to perform?
       1 - Install component(s)
       2 - Uninstall component(s)
       3 - Exit

    Your choice: 3

>>> Installation completed
    Install log /tmp/dbvisit_install.log.202012040925.
If you have followed the steps above you would now have the Dbvisit Standby GUI and Dbvisit Observer installed on the 2nd Node. In this example dbvel72
Step 3: Start the Observer component
The observer component must be started as a background process in Linux. In the below example we will show the options of Observer components and how to start it.
[oracle@dbvel72 ~]$
[oracle@dbvel72 ~]$ cd /usr/dbvisit/observer/
[oracle@dbvel72 observer]$ ls -lrt
total 11596
drwxr-xr-x. 2 oracle oinstall        6 Dec  4 09:26 log
drwxr-xr-x. 2 oracle oinstall        6 Dec  4 09:26 doc
drwxr-xr-x. 2 oracle oinstall       84 Dec  4 09:26 conf
-rwxr-xr-x. 1 oracle oinstall 11872364 Dec  4 09:26 observersvc

[oracle@dbvel72 observer]$ tree .
.
├── conf
│   ├── observer.conf
│   ├── sample_userscript.bat
│   └── sample_userscript.sh
├── doc
├── log
└── observersvc
[oracle@dbvel72 observer]$ ./observersvc -h
dbvobserver
Usage: ./observersvc [flags]
  -V	report version and exit
  -d action
    	service action.
  -ddc id
    	DDC id for resetting retries with -reset
  -f file
    	load config from file instead of system-wide /usr/dbvisit/observer/conf/observer.conf
  -log logfile
    	logfile override.  Overrides the file and path of the log.
    	Set to "-" to output to stderr.  This parameter has highest priority
    	over settings and defaults.
  -ls
    	list configs in the settings file
  -p	change the password for /api/reset call
  -reset
    	reset retries count for DDC
  -v	verbose messages
  -version
    	report full version header and exit
  -vv
    	very verbose messages
[oracle@dbvel72 observer]$ nohup ./observersvc -f ./conf/observer.conf &
[1] 5310
[oracle@dbvel72 observer]$ nohup: ignoring input and appending output to ‘nohup.out’

[oracle@dbvel72 observer]$ ps -ef |grep observer |grep -v grep
oracle    5310  4544  0 09:35 pts/0    00:00:00 ./observersvc -f ./conf/observer.conf
[oracle@dbvel72 observer]$ ./observersvc -ls     -----------> No DDC is configured to be monitored by Observer
Directory of Observer Config File:  /usr/dbvisit/observer/conf/observer.conf

                      Failed   Failed  Failed   Poll
  ID  Name  Enabled  Primary  Standby     MAX  Every
Step 4: Adding the Dbvisit Observer to the GUI
The next step once you have a standby database configured is to add the Observer to the Dbvisit Standby console.
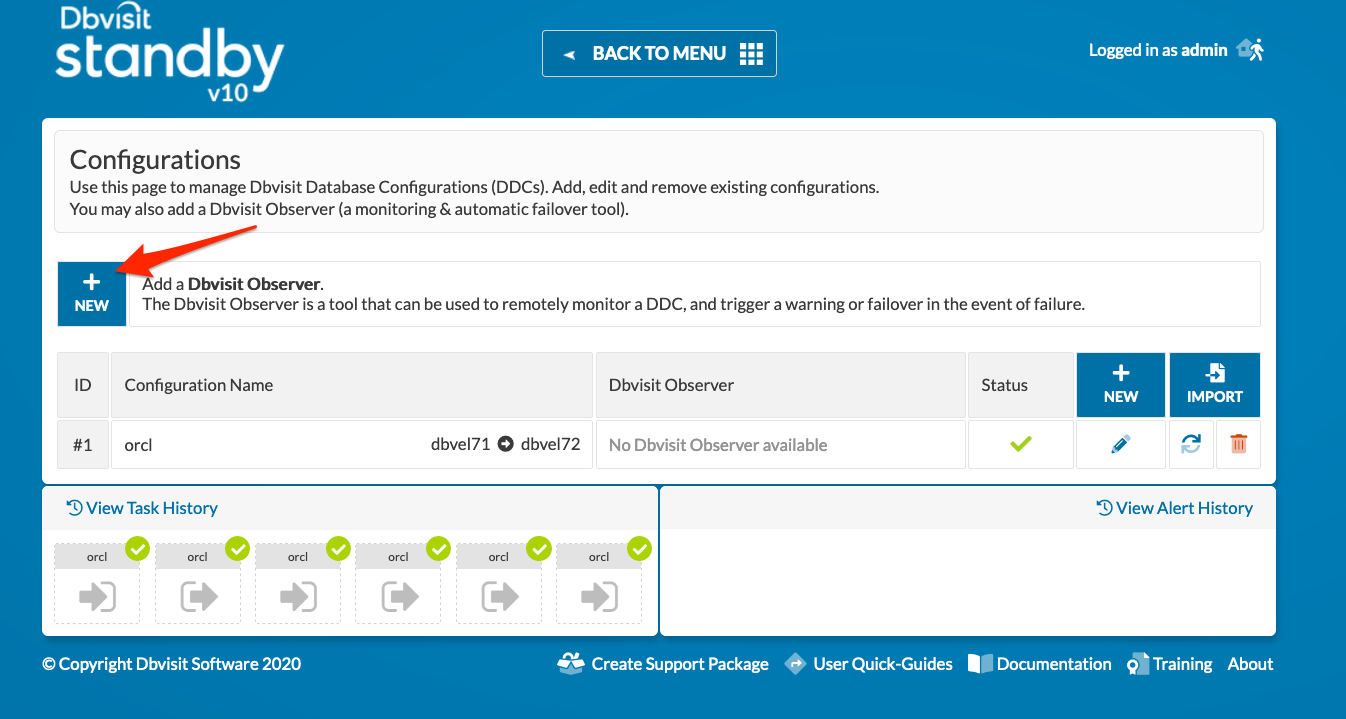
This is done by navigating to the "Manage Configurations" menu option. From the Configuration page, click on "New" next to the "Add a Dbvisit Observer" section at the top as shown below:
There are three values required to add the observer to the Central Console:
The hostname or IP where the observer is configured
The port number on which the observer process is listening (Default is port 10853)
The observer passphrase - (default is admin900)
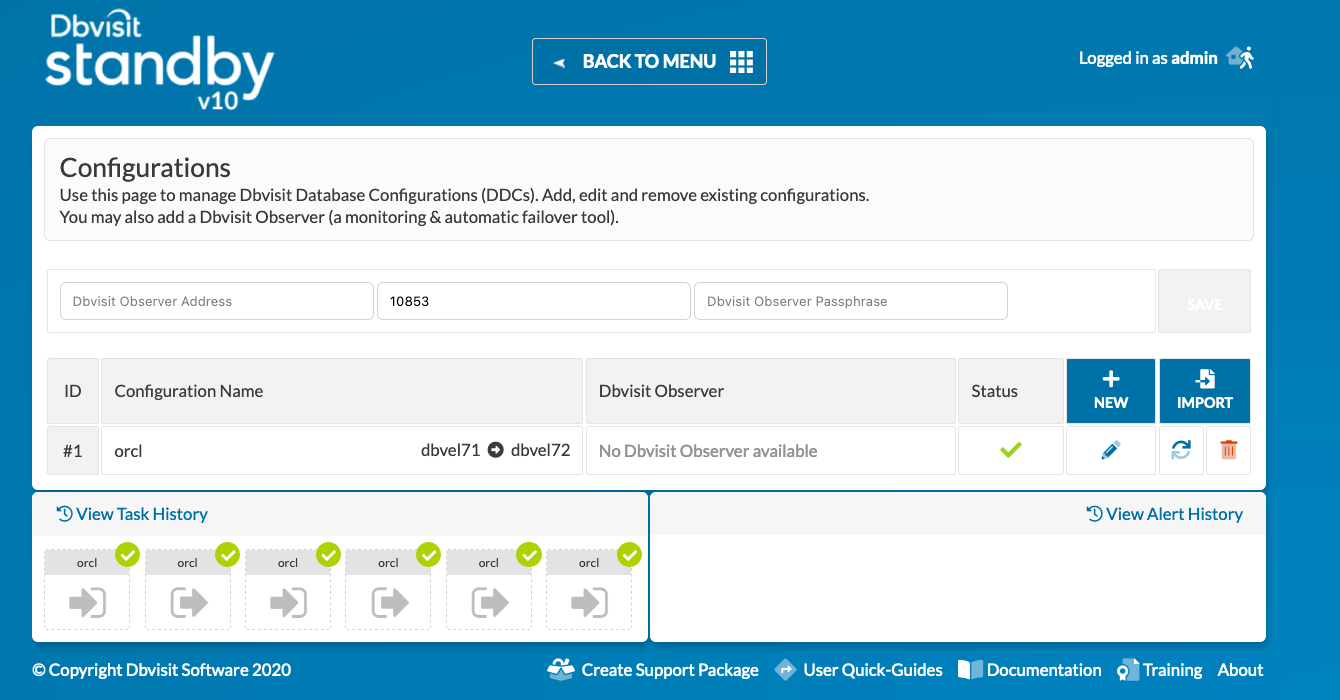
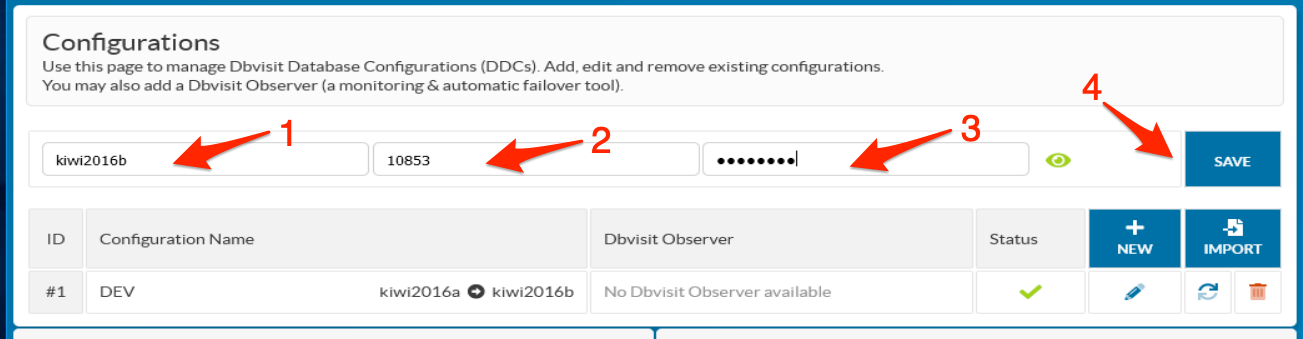
- Fill in the values as per below
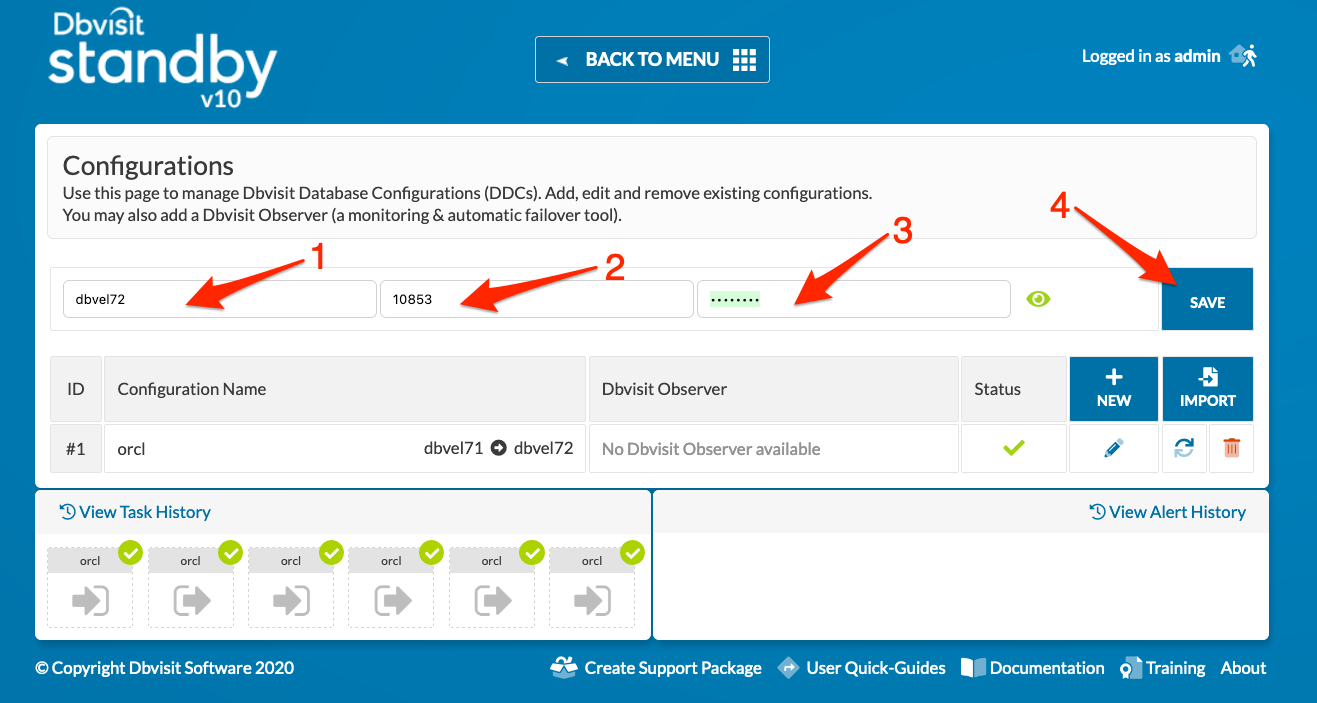
1- the hostname - in this case, dbvel72
2- the port - which is the default 10853
3- the passphrase - admin900 (the default all lower case)
4- click on Save
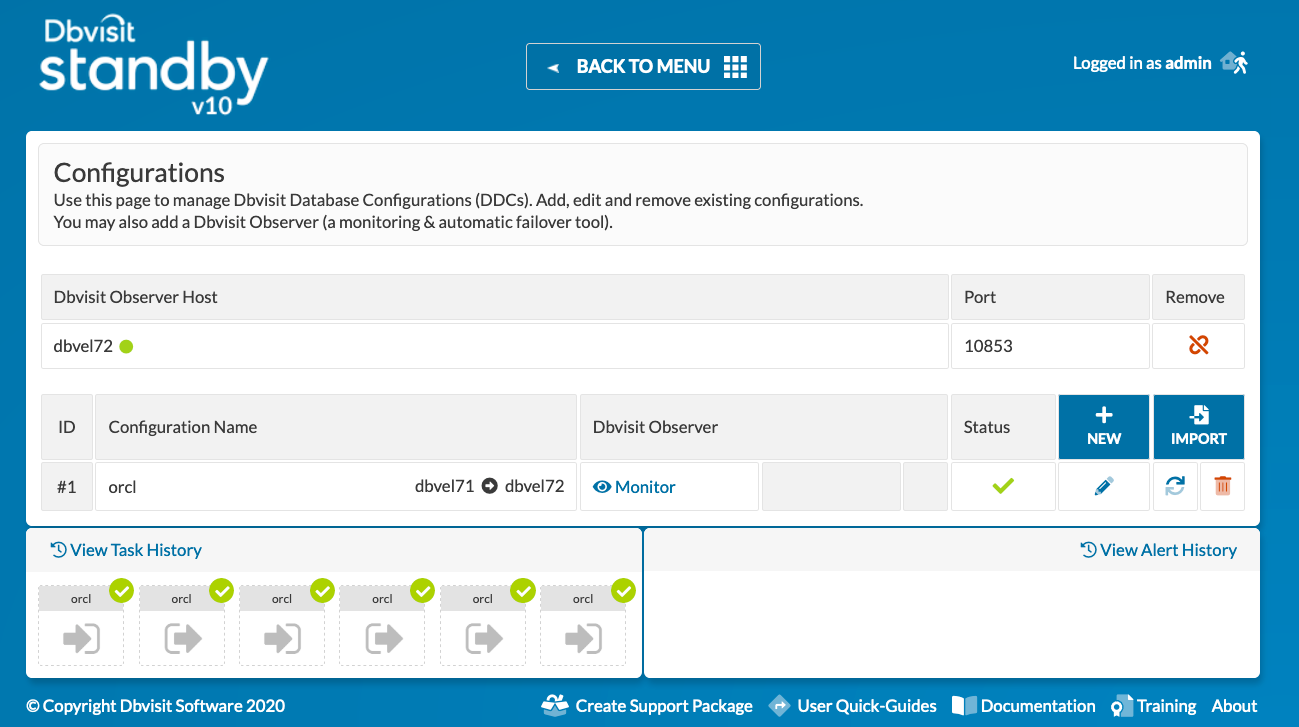
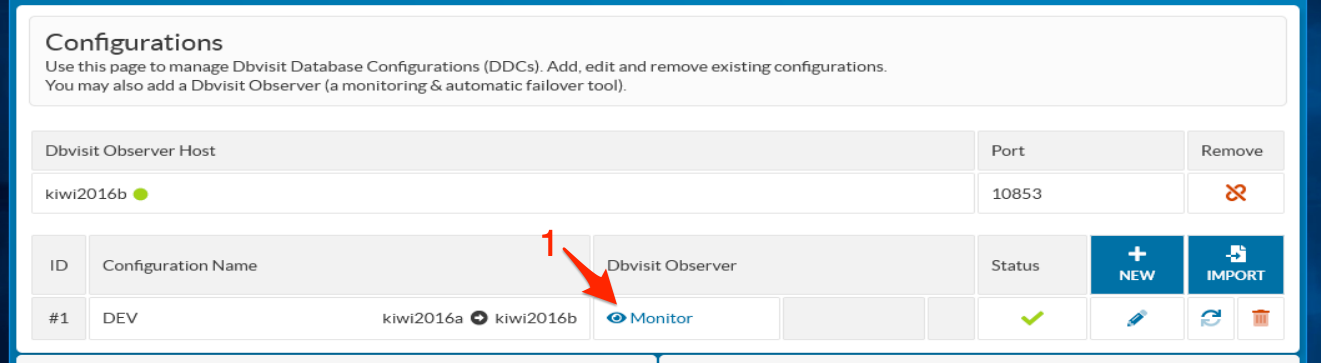
Once the above is complete you will have the observer now listed in the Configuration Section as can be seen below:
IMPORTANT: Do not modify the observer configuration file via the command line (text editor) - it must be managed via the GUI (Central Console).
If you are only using the CLI and NOT using the Central Console (Advanced users only) then you should not add the Observer to the Central Console.
You have the observer now configured, and added to the Dbvisit Standby Console. Remember: you can only have one Dbvisit Observer process per Central Console configuration.
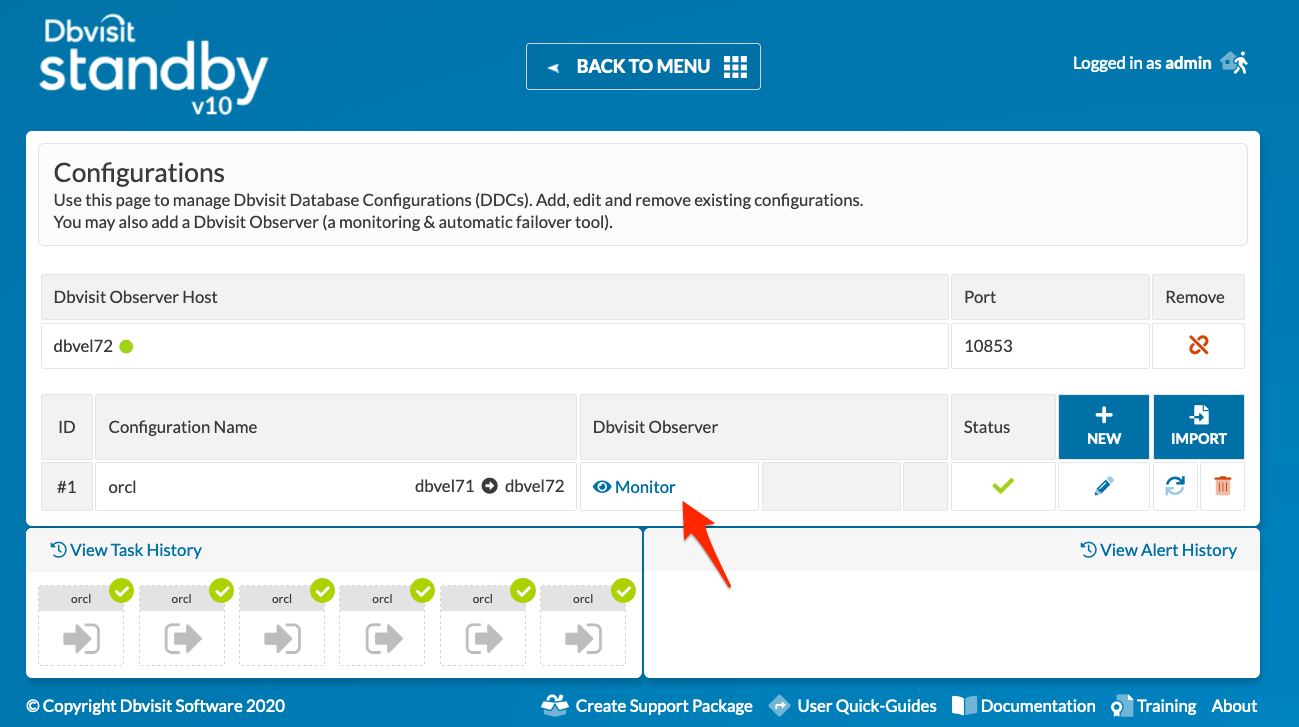
Step 5: Adding a specific DDC to the Observer for monitoring
The next step is to enable the Dbvisit Observer to monitor a particular DDC.
This is done for each specific DDC and to enable this you can click on the "Monitor" icon under the Dbvisit Observer section - as highlighted in the section below:
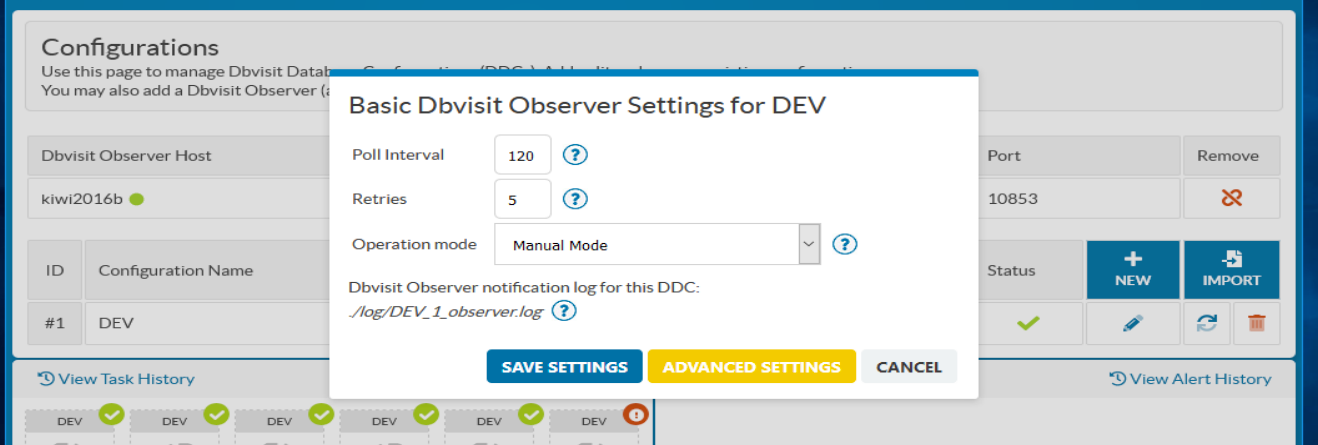
Once you click on Monitor the following dialogue will be displayed:
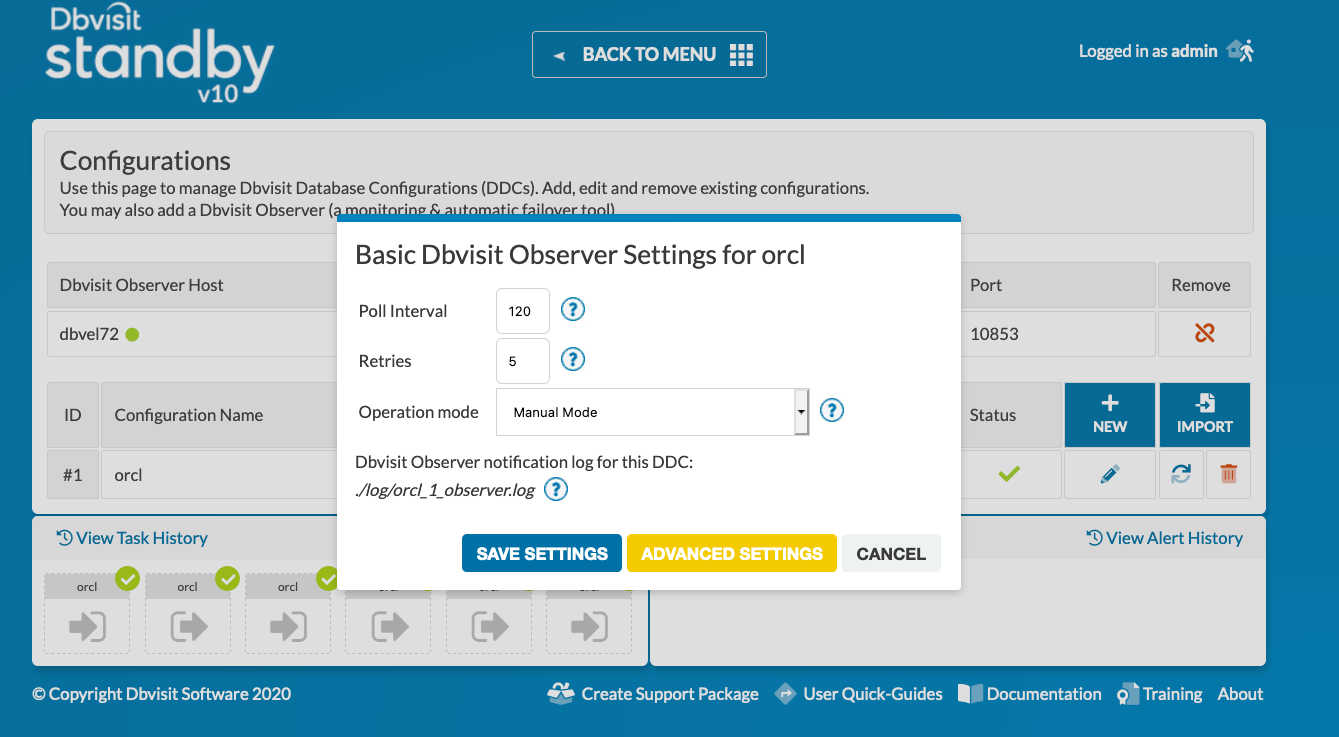
This dialog will show you the basic settings you can configure:
1- The Poll Interval
This is in seconds and indicates how often the Dbvisit Observer should monitor the particular configuration.
NOTE: It is very important that this poll interval is always greater then your expected network delay/timeout. For example, if a connection to your Primary or Standby host fails, how long does it take to timeout and report an error? If this is 60 seconds (a common default network timeout setting), this poll interval should be set to at least 61 seconds.
Setting the poll interval to a value less than the expected network delay/timeout can result in various incorrect error states being reported by the Observer.
If you do not want to modify your network timeout settings, but still want to set the Observer poll interval to be less than the maximum expected values for these, you can do so by use of the advanced "remote_timeout" parameter - please refer to the Advanced Configuration Parameters section below.
2- Retries
The retry option is the number of times the Dbvisit Observer will monitor the particular DDC if a Failure is detected, Example, in the above the Observer will monitor the specific DDC configuration every 2 minutes (120 seconds), and if any errors are detected it will retry 5 times. After 5 errors (failures of the rules, more on this below), the "Operation mode" action will be executed.
3- Operation Mode
The operation mode is a very important setting - this is where you can select between two options:
"Manual Mode" - This is the default and puts the Dbvisit observer in what is called a "Dry Run" or Observe Only mode, meaning if a failure of the rules is triggered, Alerts will begin appearing in the GUI and Notifications will be sent out (configured under Advanced Settings) but the standby database is will NOT be activated. So no actual Automatic Failover is performed. It is highly recommended that this option be used for thorough testing in your configuration before you enable the "Failover Mode" - which if enabled will perform activation of the standby if the rule checks fail.
"Failover Mode" - This is the "real mode" of the Observer, where Automatic Failover (Activation) of the standby database will be performed if the rule checks fail the maximum specified number of times (as set in the Retries setting). For example, if the primary database goes down, and stays down for more than 10 minutes in this scenario (5x retries of 120 seconds each), the Failover will be triggered and the standby database will be activated. Note that Notifications will also be sent if enabled under the Advanced Settings section.
4- Log File Notification
By default as soon as you enable a DDC to be monitored by Dbvisit Observer, a log file will be created for any notifications specific to that configuration This log file is created on the node where the observer is running, which in this example is dbvlin03 and the location is: /usr/dbvisit/observer/log as we installed the Dbvisit Observer into the default DBVISIT_BASE location which is /usr/dbvisit. This setting cannot be disabled or modified. Note that this log will only contain DDC-specific entries, the same entries that would be sent out for any of the Notifications specified for the DDC in Advanced Settings. The full Observer log, including non-DDC-specific events, can be viewed in the Observer installation directory under /log/observersvc.log.
If you now click on SAVE SETTINGS, the default rule ("observer", specified on the Advanced Settings page, more on this below) will be applied, and monitoring of the DDC will begin.
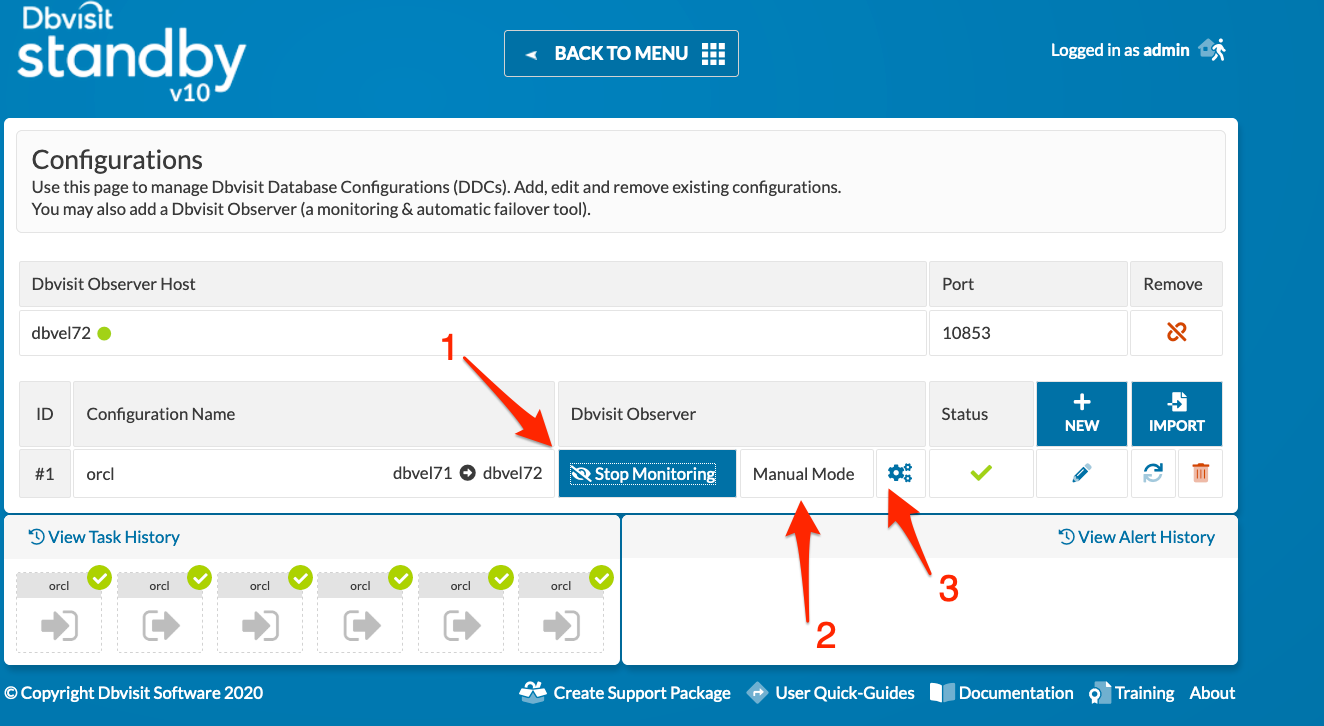
The particular DDC - in this case, orcl - is now being monitored. The monitoring can be stopped at any time by selecting the "Stop Monitoring" option. You will also notice the Operating Mode which in this case is "Manual Mode" is displayed. This means that this configuration is only being monitored (Auto Failover if off), and if the connectivity checks fail, only notifications will be sent and the monitoring will be stopped. No Automatic Failover will happen, as in Manual Mode, the Dbvisit Observer is only, funnily enough, observing.
[oracle@dbvel72 observer]$ ./observersvc -ls
Directory of Observer Config File:  /usr/dbvisit/observer/conf/observer.conf

                        Failed   Failed  Failed   Poll
  ID    Name  Enabled  Primary  Standby     MAX  Every
   1  "orcl"     true        0        0       5   2m0s
There are also the settings as shown above in point [3], which can be used to configure the monitoring for this DDC in more detail, such as enabling email notifications or changing the ruleset.
Step 6: Advanced Configuration
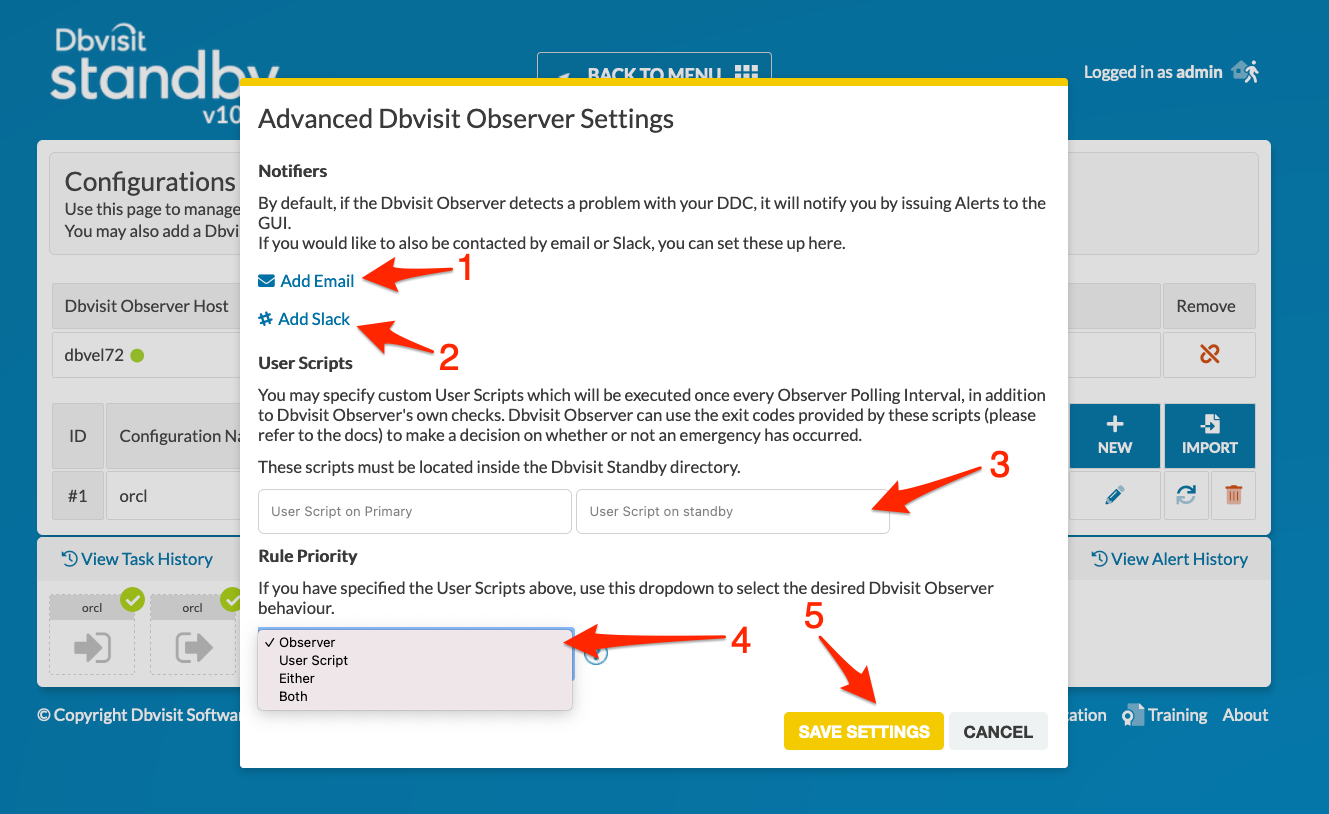
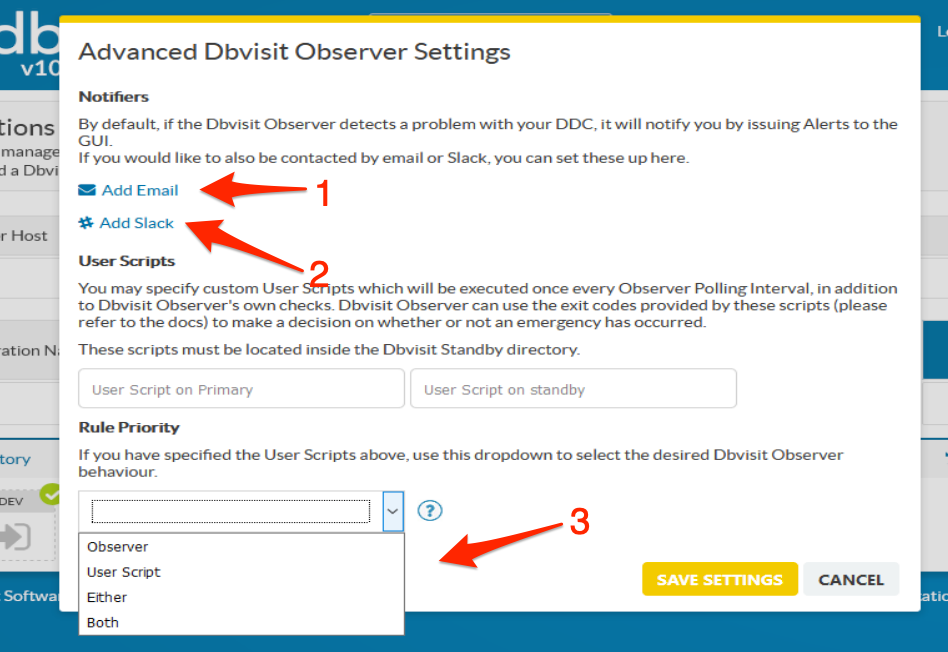
Once you click to edit settings for a particular DDC, you can navigate to the "Advanced Settings" section, from where you can configure the following:
- Email and Slack Notifications
- User Scripts (this can be a user shell script that is located in the DBVISIT_BASE/standby folder on both the primary and standby)
- Selecting the Rule Priority - default is "Observer", which means connectivity and database status checks only
We will now cover each of these in detail.
Windows Installation
Step1:
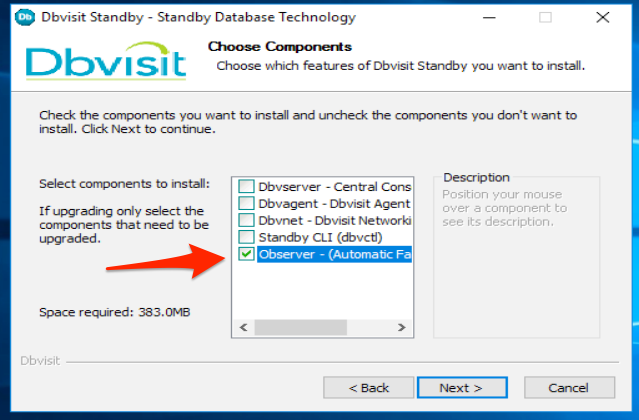
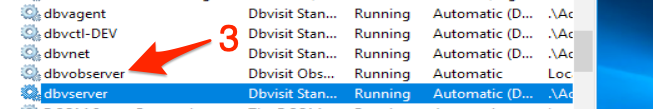
The observer installation is similar to the installation of the other dbvisit components in windows. Double click on the Installation executable and when you click Next you will see the options to install the Dbvisit components. You can see the option of the Observer as well [ 1].
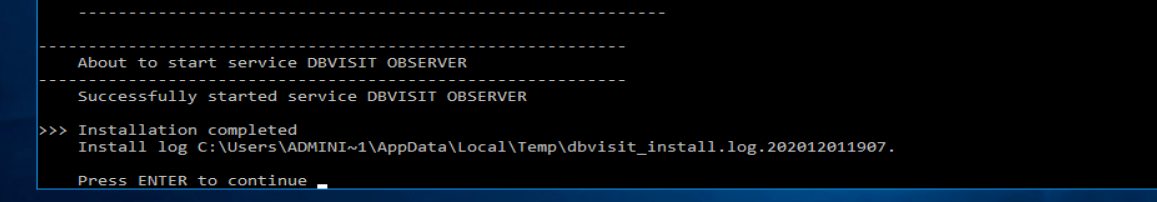
Once the installation steps are completed, the observer service is started [2 ], you can check the service status from windows services [3 ].
Step2: Configuration
The configuration is exactly the same as the Linux configuration and its done from the central console. Go to Manage Configurations page and click on New
- Enter the host in which Observer was installed.
- The default port for Observer is 10853
- The password is admin900
- Save the configuration
- Click on Monitor to configure the Observer and to start monitoring the Standby database.
The default configuration has poll interval as 120 and retries as 5 with Manual mode (this does not activate the standby)
Advanced Configuration Parameters
This is a list of all the advanced parameters that can be manually set in the Observer's configuration file to fine-tune your installation for specific advanced circumstances.
WARNING: These are advanced parameters, and setting them should be unnecessary in the vast majority of cases. Please contact Dbvisit Support for assistance if you need to use any of these parameters.
remote_timeout
This parameter dictates the maximum length of time Observer connections will wait before considering the remote host to be offline. The default value for this parameter is 120 seconds.
You should not have to modify this parameter unless you have highly unusual network connectivity and/or routing.
To set a custom value for this parameter, you must add it manually to your Observer configuration file, as so:
...
      "poll": 5,
      "retries": 3,
      "remote_timeout": 10
...
The value is in seconds.
One use-case for this parameter is to mandate a lower maximum timeout value than your network configuration would otherwise provide. For example, if your default network timeout is 60 seconds, but you want the Observer to monitor your configuration every 20 seconds, and consider a host to be offline after 10 seconds, you could set this parameter to 10. This would mean that although a connection through your network would not typically be considered unsuccessful until a full 60 seconds have gone by, the Observer will only wait a maximum of 10 seconds before dropping the connection attempt and considering it unsuccessful.
Notifications
Notifications allow you to stay informed about any failure events that occur to a DDC while the Observer is monitoring. Different notifications can be set up on each monitored configuration (DDC).
If no notifications are set up for a DDC, then only the DDC-specific log is enabled (you can see the name/location of this log on the Basic Settings screen).
Please note: Even if no notifications are enabled, all observed events will still always show up in the Central Console (GUI) in the form of Alerts. This functionality is always on, and cannot be switched off.
There are two notification channels that can be utilized:
- Slack (via Incoming Webhook)
Configuring Slack
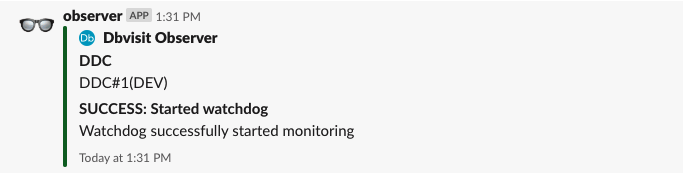
If you configure the Slack Notification option, the Observer will send messages to a preset Slack #channel you define.
For example, if the Observer is starting to monitor a particular configuration you will see a message like this:
Slack notification can be configured on the Advanced Settings screen for a specific DDC configuration:
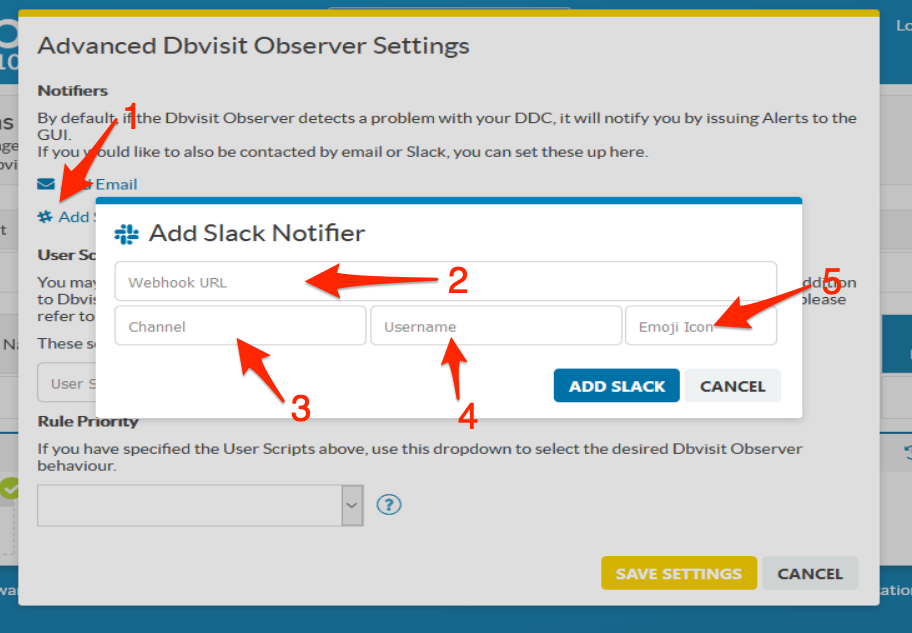
In order to set up Slack Notifications you'll need to provide the following parameters:
- Click on "Add Slack" in Advanced Settings
- Slack Incoming Webhook URL. This must be available and pre-configured for your Slack Workspace. All team members can use the same Webhook API.
- Channel to report to. This can be a Private/Public Channel in your workspace, or if an individual wishes to have Slack alerts the channel is the 'memberid' found on their profile page.
- Make up a username for Observer to use. For example - "observer".
- Pick a Slack Emoji icon to use. Any of the Slack icons can be chosen, simply hover over one to see the :shortcut: value. For example - :eyeglasses:.
Once these parameters are set (and Saved), The Observer will start sending notifications to your Slack channel.
Configuring Email
Email notifications are set up from the same place as the Slack notifications above.
You will need to provide the following parameters:
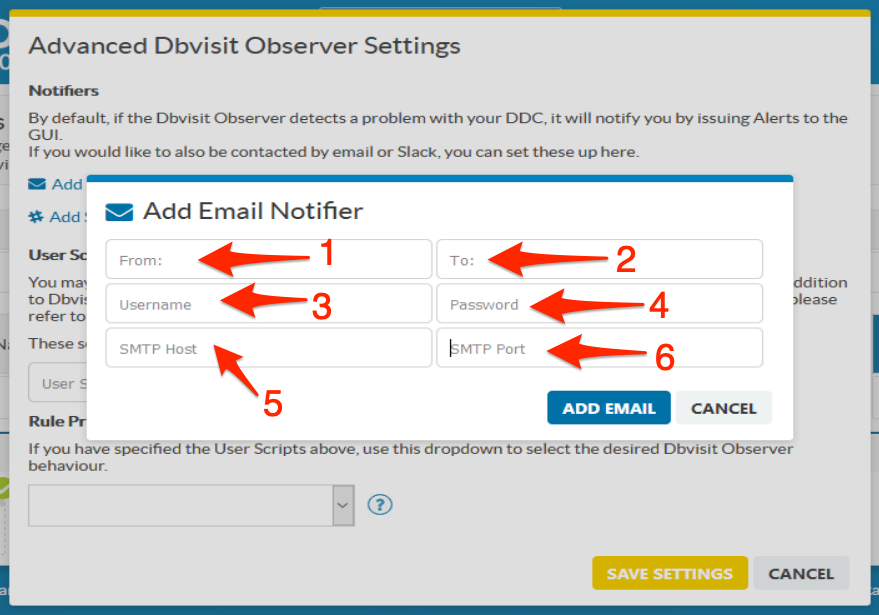
- The "From" email address
- The "To" email address
- The username for email account authentication
- The password for the user
- The SMTP server address
- The SMTP server port
Dbvisit Observer supports SSL/TLS encrypted SMTP connections.
When you configure email and the settings are applied, you will get an email on the next start of the monitoring for the configuration that will contain text similar to the following:
Hi there,

This is a notification message from Dbvisit Observer.

DDC: DEV

Watchdog successfully started monitoring
Logging
The Dbvisit Observer log contains important information about the actions taken by Observer.
Default log location: $INSTALLATION_DIRECTORY/log/observer.log
User Scripts (User Checks) & Rule Priority (Automatic Failover Rules)
One of the advanced features of Dbvisit Observer is the provision for the user to add their own checks into the Observer behaviour.
This feature works together with the Rule Priority setting immediately following it, which provides control over how these scripts interact with the Observer's own internal logic.
Types of Observer Checks
The two basic types of Checks that the Observer performs can be summarized as follows:
- Observer Rule Check: Observer connectivity and database availability checks.
- These are the Observer's own built-in checks;
- They monitor the primary and standby databases for connectivity, including making sure they are in their expected states
- User Script Rule Check: custom script or program execution:
- The DBA or system administrator can add your own checks to the environment. It could be connectivity checks, storage checks, application checks, anything they might want to validate for the environment.
- The requirement for the user script - which must exist on both primary and standby in the DBVISIT_BASE/standby folder - is that it can have only 3 possible exit codes which will be monitored by the Observer:
- 0 = OK everything is good
- 1 = WARNING and is seen as good by the Observer
- 2 = ERROR and this is seen as a failure, meaning the user script executed, and a failure was detected.
The user can provide a shell script or executable which can be used by the Observer, in addition to its own checks, to determine whether a state of emergency exists on the configuration. Any shell script or compiled executable can be used, as long as it handles the required input and provides the correct output - exit codes. A sample script is provided with the Dbvisit Observer installation, and it is located in the ../dbvisit/observer/conf/sample_userscript.sh file.
These two types of Checks can be combined in the following ways by using the Rule Priority dropdown setting on the "Advanced Settings" screen:
- Observer - System connectivity checks only (the default setting, the Observer's built-in logic)
- User Script - Execute the User Scripts (checks). the Observer's own connectivity checks are conducted, but the results are ignored
- Either - If either of the system connectivity checks or the User Script checks fail, a Failover will be initiated (if in Failover Mode)
- Both - If both the connectivity checks as well as the user checks fail, a Failover will be initiated (if in Failover Mode)
These possible combinations are known as Rule Sets. Within each Rule Set, at least one Rule is considered as Critical. If the Critical Rule fails, this failure will be counted towards the maximum Retries setting that is specified for each DDC. Once this "failed count" has exceeded the Retries number, the Observer will Failover the DDC (if in Failover Mode).
Here is a detailed table describing Rule Set logic:
| Name | Rules | Critical | Increase to Failed Count |
|---|---|---|---|
| Observer | Observer Check | yes | 1 |
| User | Observer Check | no | 1 |
| User Check | yes | ||
| Either | Observer Check | yes | 1 |
| User Check | yes | ||
| Both | Observer Check | yes | 2 |
| User Check | yes |
Rule Algorithm
This is the step-by-step breakdown of the exact logic behind how the Observer conducts its checks:
- Check the standby host availability by sending a request to Dbvagent.
- If the standby host is available - continue. Otherwise - notify the user and terminate the check. NOTE: While primary host will only be checked up to the set Retries number of attempts, after which Failover will occur if in Failover Mode, Standby will be checked indefinitely until either successfully contacted, or the Observer is manually disabled. The reason for this is that if no Standby is available, there is nowhere to Failover to, and thus the entire function of the Observer is compromised.
- Check the standby database.
- If the standby database is available - continue. Otherwise - notify the user and terminate the check.
- Check the primary host availability by sending a request to Dbvagent.
- If the primary host is available - continue. Otherwise: Attempt to contact the primary host through Dbvnet by routing through the standby host. This is done in case there is a network problem between the Observer and the primary, but not between the primary and standby.
- If the primary host is available - continue. Otherwise: FAIL the Rule.
- Check the primary database state.
- If the primary database is available - continue. Otherwise: FAIL the Rule.
- END (success).
User Script Input
This section will provide more detail on how this script is used and executed.
If using User Scripts, you must have one on both the primary and standby server inside the DBVISIT_BASE/standby folder.
The user script takes a number of arguments:
- DDC name - a name of DDC for which the check is being executed.
status - is a state of the previous rule in the rule chain (previous rule is the Observer's own connectivity and system health check), can be one of the following:
ok- previous rule returned no errorsfail- previous rule returned an error
role - the database role of the database where the error occurred, can be one of the following:
not_applicable- this is when there's no errorprimary- the previous error was on primarystandby- the previous error was on standby
error_type - type of error occurred:
err_none- no errorerr_connection- there was a connection errorerr_database- there was an error on a database, or the database is in an invalid state
hostname - if the error_type is not err_none - will contain a hostname of the node where the error occurred, otherwise, this parameter is empty.
When the user script is invoked, it will be invoked as follows:
./usercript.sh <DDC name> <status> <role> <error_type> [hostname]
NOTE: The script is executed from the DBVISIT_BASE/standby folder from both primary and standby
Example:
# successful connectivity checks passed and user script is executed:

./dbvobs-userscript.sh PROD ok not_applicable err_none

# Failure in the database connectivity checks files and the user script is executed (it is always executed after connectivity checks)

./dbvobs-uscript.sh PROD fail primary err_database dbv1
Once you have your User Scripts in place, for example in /usr/dbvisit/standby/obs-uscript.sh, you can add them to the Dbvisit Observer configuration on the particular DDC for which you want to use them. This can be done on the Advanced Settings screen as shown below:
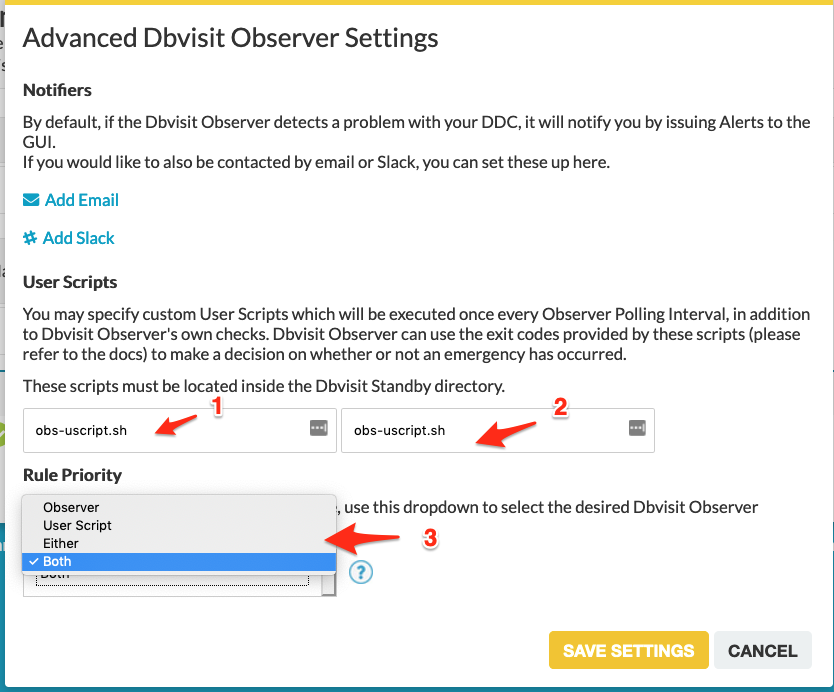
- The user script specified on the primary
- The user script specified on the standby
- The Rule Priority options discussed above
Once you enter the script filename, you should see a green tick appear at the end of the input field to indicate the system can see the script, and it contains code.
Once you have entered your script filenames, confirmed them by witnessing the green tick, selected the Rule Priority and Saved Settings, your DDC is now being monitored by the Observer in accordance with your settings.
Start and Stop - Dbvisit Observer
Starting the Dbvisit Observer process can be done as follows:
oracle@dbvlin101[/usr/dbvisit/observer]: ls
conf  log  observersvc
oracle@dbvlin101[/usr/dbvisit/observer]: nohup ./observersvc -f conf/observer.conf &
[1] 2799
oracle@dbvlin101[/usr/dbvisit/observer]: nohup: ignoring input and appending output to ‘nohup.out’

oracle@dbvlin101[/usr/dbvisit/observer]: ps -ef|grep obs
oracle    2799  2263  1 00:37 pts/2    00:00:00 ./observersvc -f conf/observer.conf
oracle    2812  2263  0 00:38 pts/2    00:00:00 grep --color=auto obs
oracle@dbvlin101[/usr/dbvisit/observer]:
Note that the Dbvisit Observer process is a foreground process which is put in the background using the "nohup" command.
On Windows-based systems it will run as a Windows Service and on Linux based systems it can be run using "nohup" or as a Systemd startup process.
Stopping the Dbvisit Observer on Linux can be done as follows:
- Use "ps -ef|grep observer" to obtain the process id
- Then use this process id to send a kill signal to, example:
oracle@dbvlin101[/usr/dbvisit/observer]: ps -ef|grep obs
oracle    1197     1  9 Jul10 ?        01:48:56 ./observersvc -f conf/observer.conf
oracle    2494  2263  0 00:33 pts/2    00:00:00 grep --color=auto obs
oracle@dbvlin101[/usr/dbvisit/observer]: kill -9 1197
oracle@dbvlin101[/usr/dbvisit/observer]: ps -ef|grep observer
oracle    2506  2263  0 00:33 pts/2    00:00:00 grep --color=auto observer
oracle@dbvlin101[/usr/dbvisit/observer]:
Alert Notifications
On the main menu screen of Dbvisit Standby you will see at the bottom right the Alert History panel. In this panel the alert notifications will be displayed to the user which the user can then review and acknowledge.
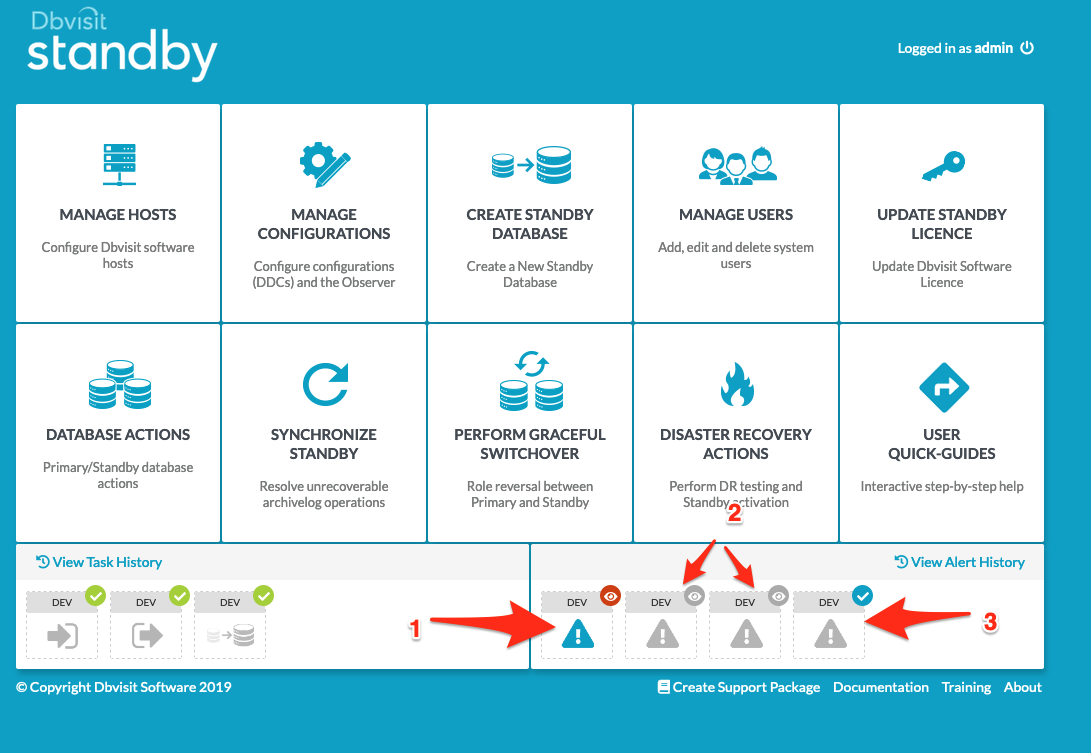
Some basic notes on Alerts:
- Alerts in blue are Active Alerts. This means that the event the Alert represents is still relevant/on-going. The small red eye in the top right-hand corner of the Alert indicates this Alert came from the Dbvisit Observer.
- These grey Alerts are "finished". This means the events they represent are no longer relevant, i.e. they were resolved, one way or another. You can still view the full history of the Alert by clicking on it.
- Alerts can be acknowledged and commented on by the user. The presence of a blue tick icon means this Alert has been acknowledged, and you can view any comments for it by hovering over with your mouse.
Adding "observersvc" to systemd
One of the options available to you to run the Dbvisit Observer as a Linux service that wills start on system reboot is to make use of systemd, which is available from Oracle Linux 6 and above (also RHEL 6+).
KNOWN ISSUE:
- If you are using the observersvc via the systemd process, and you add new configurations - DDCs to monitor, by default it will add a LOG file for notifications. This log is going to be written to the path from where the observer was started and as the observer when running under the systemd is started from "/" (root) it will try and create log files under /log/ for the configurations. This will be resolved in the next update of the observer in 1.04 (Dbvisit Standby 9.0.04)
- Work-around:
- Add a directory /log/ and make sure the user running observersvc (oracle Unix account) has permissions to write to this folder.
You first create a service file in /usr/lib/systemd/system called dbvisitobserver.service
Below is an example:
[Unit]
Description=Dbvisit Observer provides an automatic failover for Dbvisit Standby.
ConditionFileIsExecutable=/usr/dbvisit/observer/observersvc
After=syslog.target network.target

[Service]
Type=simple
RemainAfterExit=yes
StartLimitInterval=5
StartLimitBurst=10
ExecStart=/usr/dbvisit/observer/observersvc -log /usr/dbvisit/observer/log/observer.log -f /usr/dbvisit/observer/conf/observer.conf
User=oracle
Group=oinstall
Restart=always
RestartSec=120
# EnvironmentFile=/etc/sysconfig/DbvisitObserver

[Install]
WantedBy=multi-user.target
Once you have the above file, you will need to execute the following commands to enable it:
oracle@dbvlin03 /usr/dbvisit/observer : sudo systemctl daemon-reload
oracle@dbvlin03 /usr/dbvisit/observer : sudo systemctl enable dbvisitobserver.service
oracle@dbvlin03 /usr/dbvisit/observer : sudo systemctl status dbvisitobserver.service
oracle@dbvlin03 /usr/dbvisit/observer : sudo systemctl start  dbvisitobserver.service
Please note the above is an example and some changes may be required for your environment
How to Perform an Automatic Failover
Part 1